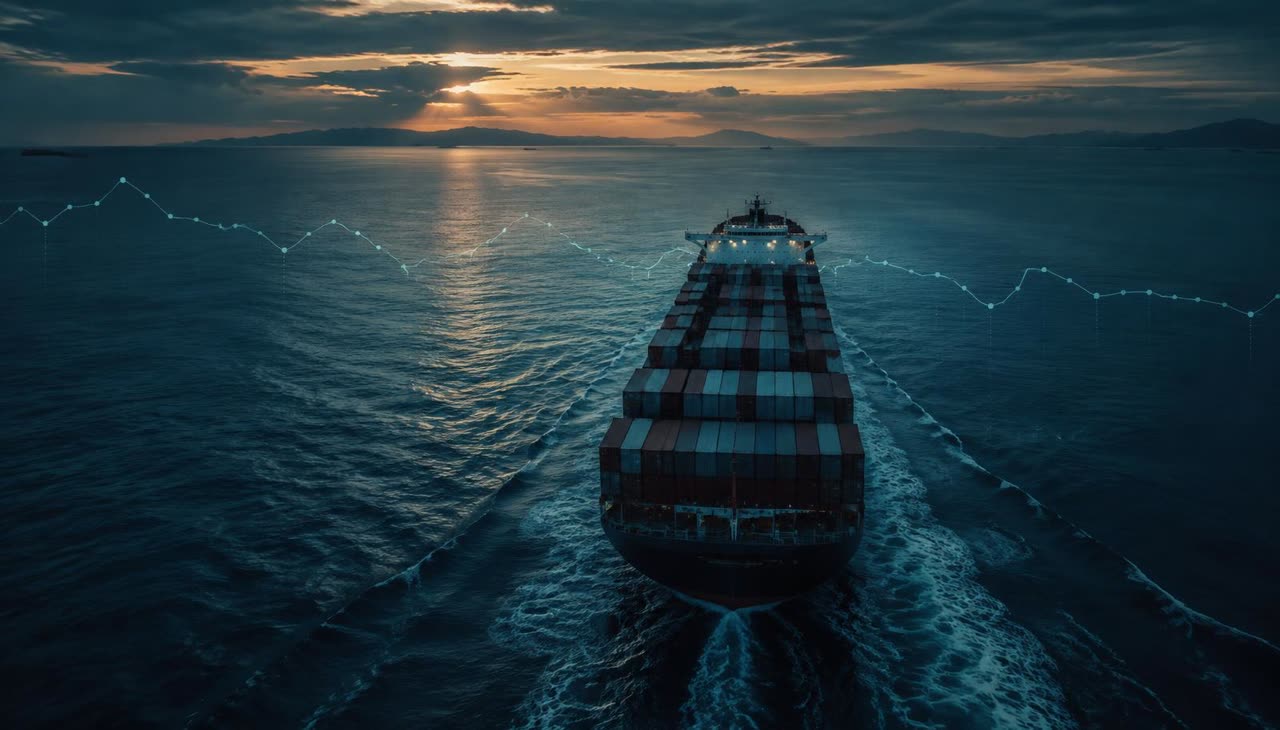
Deconstructing Historic AIS Vessel Tracks in Operational Context
Commercial maritime operations rely heavily on historical Automatic Identification System (AIS) trajectories to reconstruct voyages. When operations desks monitor ocean legs, analyzing past coordinates provides an objective spatial trail of a vessel's path. However, freight operations teams must strictly differentiate between raw positional telemetry and true vessel execution data.
A digital track plotted between historical pings indicates where a ship broadcast its position, but relying on simplified point-to-point mileage calculations often misleads desks evaluating transit adherence, demurrage disputes, or carbon metrics. Through integrated forwarding platforms like FocusFlow's vessel tracking, operations teams capture verified AIS pings across key maritime waypoints. Understanding the technical boundaries of this data is necessary to avoid flawed operational assumptions.
What Recorded AIS Tracks Can Accurately Confirm
Historical positional traces deliver critical visibility into macro-routing decisions and port-approach timelines:
- Route Deviations and Bottleneck Avoidance: Plotting timestamped coordinates definitively verifies whether a carrier executed a planned canal transit (such as Suez or Panama) or opted for long-haul diversions around the Cape of Good Hope.
- Anchorage and Waiting Duration: Recorded positions confirm the exact duration a vessel remained stationary or drifted in offshore waiting areas, providing an audit trail against port congestion claims.
- Emission Control Area (ECA) Exposure: Positional points confirm precisely when and for how many nautical miles a vessel operated inside regulated coastal sulfur control boundaries.
- Historical Speed Over Ground (SOG): AIS timestamps provide accurate calculation of speed over ground, proving whether an ocean carrier was actively slow-steaming to absorb schedule buffers.
What AIS Distance History Cannot Prove
Despite its utility, historical AIS track analysis presents inherent technical boundaries established by international maritime communication standards:
- Reception Latency and Spatial Gapping: AIS signals experience terrestrial line-of-sight limits and satellite latency, particularly in high-density corridors or mid-ocean segments. Calculating voyage length by connecting widely spaced pings creates straight chords across curved routes, consistently understating actual distance traveled.
- Speed Over Ground vs. Speed Through Water: AIS broadcasts speed over ground (SOG) relative to the earth's surface. It does not measure speed through water (STW), surface currents, wave resistance, or trim. A vessel sustaining 14 knots SOG against a 3-knot adverse ocean current expends dramatically different engine power compared to sailing with a favorable stream.
- Absence of Bunker and Machinery Telemetry: Standard maritime transponders governed by ITU and IMO technical specifications transmit kinematic and navigational data, not engine telemetry. AIS carries no real-time fuel consumption logs, generator load metrics, or auxiliary engine data. Distance history alone cannot reveal how much bunker fuel was burned during a leg.
Translating Track Distances into TEU-Level Carbon Estimates
Freight forwarders and carbon practitioners frequently incorporate historical nautical mileage into Scope 3 transport reporting. When applying carbon calculation standards, teams must observe proper data labeling.
Because AIS feeds provide positional tracks rather than measured engine fuel burn, operational carbon tools calculate emissions by combining verified sailing distances with vessel class averages, nominal load factors, and clean cargo allocation assumptions. Therefore, any resulting distance-based carbon figure represents an estimated one-TEU footprint, not the ship's actual aggregate bunker consumption. Forwarders utilizing FocusFlow's ISO 14083 & CSRD reporting modules apply recorded track distances to eliminate theoretical great-circle assumptions, yielding a defensible model while acknowledging that direct vessel fuel consumption remains unmeasured.
Checklist: Operational Audit of Historic Vessel Track Data
When auditing carrier performance or calculating mileage-based metrics from track archives, apply this five-step verification checklist:
- Audit Ping Density: Check for geographic gaps greater than six hours between AIS logs before calculating total sailed nautical miles.
- Apply Great-Circle Slicing: Ensure calculation algorithms compute geodesic arcs between consecutive coordinates rather than flat Euclidean projections.
- Filter Anchorage Jitter: Strip out low-speed positional drift logged while a vessel is anchored to avoid inflating operational transit mileage.
- Distinguish SOG from Engine Effort: Do not equate low speed over ground in recorded logs with low engine throttle settings without checking prevailing weather and current charts.
- Label Emissions as Modeled: Explicitly document that Scope 3 container carbon computations derived from track mileage are estimated TEU allocations, not verified fuel meter readings.
Frequently Asked Questions
Why does the sum of recorded AIS segments differ from carrier bill of lading distances?
Carrier bills of lading frequently reference standard port-pair tariff tables or theoretical rhumb-line routes. Recorded AIS tracks capture the actual path navigated, including weather avoidance maneuvers, anchorage holding patterns, and navigational channel detours.
Can historical AIS tracks prove that a carrier slow-steamed to save fuel?
AIS tracks prove historical speed over ground. While lower speeds typically correlate with lower propulsion power, AIS cannot confirm whether deceleration was intentional slow-steaming, a consequence of heavy weather resistance, or an engine running at partial load due to mechanical derating.
Does FocusFlow store raw bunker consumption metrics alongside track history?
No. FocusFlow records real AIS vessel positions, timestamps, and voyage waypoints. Because commercial vessels do not broadcast proprietary fuel flow sensors over open AIS frequencies, all emissions figures derived from track mileage represent modeled TEU estimates based on standardized allocation principles.
Sources
- International Maritime Organization (IMO) AIS Requirements: https://www.imo.org/
- International Telecommunication Union (ITU-R M.1371 Technical Standard): https://www.itu.int/
- ISO 14083:2023 Greenhouse Gas Transport Operations Standard: https://www.iso.org/standard/78864.html
- Smart Freight Centre (GLEC Framework Methodology): https://www.smartfreightcentre.org/